Creating a Financial Forecasting Dashboard in monday: Go Beyond Spreadsheets in 2026
- Ishani Dhar Chowdhury

- Feb 18
- 7 min read
How to Create a Financial Forecasting Dashboard in monday?
To create a financial forecasting dashboard in monday, you must leverage the customisable boards and formula columns. Do this to track revenue, expenses, and projections in real time.
Then connect the expense boards to project data to build a comprehensive budget vs actual reporting across monday systems. This will automatically calculate variances and highlight trends.
Once done, the platform's dashboard widgets can help transform raw financial data into visual insights. It comes with cash flow visualisation tool capabilities to enable proactive liquidity management through automated alerts and timeline views.
Similarly, the no-code customisations, automated workflows, and seamless integrations in monday.com for finance transform traditional spreadsheets into dynamic financial command centres. As a result, CFOs and finance teams can get instant visibility into organisations' performance to accelerate strategic decision-making.

Are your CFOs still stuck with static spreadsheets to manage the organisation's financial forecasts?
Over time, the traditional approach to financial planning has become obsolete.
According to Cherry Bekaert's CFO survey, 76% of finance leaders want to streamline accounting and finance processes.
Gone are the days of endless Excel tabs, manual data updates, and version control nightmares. With a financial forecasting dashboard in monday, your team can revolutionise how they visualise and act on data.
monday.com for finance and accounting is a transformative solution that enables budget vs actual reporting. Moreover, the automatically updated dashboards can be used as a cash flow visualisation tool.
In this blog post, we'll explore how CFOs leverage monday WorkOS to create dynamic forecasting dashboards to get rid of traditional spreadsheets.
Why Do Finance Leaders Need Financial Forecasting Dashboards in monday?

To put it bluntly, spreadsheets often lack real-time visibility, leading to collaboration bottlenecks. Moreover, version control becomes challenging due to the hours spent consolidating data.
Even IBM reports that it's time to move on from outdated spreadsheet management. A UK-based wine retailer lost 60% of their market value due to an arithmetic error in MS Excel.
It's highly likely that by the time CFOs have compiled last month's numbers, the overall conditions will have shifted. That's why your team needs a financial forecasting dashboard in monday.
Reasons to Choose monday.com Dashboards for Financial Forecasting
It will bridge the gap between financial planning and operational execution. How? With connected data and automated updates.
Beyond that, you should benefit from the budget vs actual reporting in monday because:
Team dashboards offer exceptional real-time accuracy.
Live dashboards show variances as they happen.
Automatic dashboard updates eliminate manual data entry.
Shared dashboards to give everyone visibility into financial performance and targets.
The team at Fruition can help you transition from fragmented spreadsheets to a unified forecasting system. We'll establish the best cash flow visualisation tool with real-time sync, no manual consolidation, and automated variance analysis features.

All that will help you with instant variance analysis to spot trends early and address issues when necessary. Being a monday Platinum Partner gives our 27+ experts the ability to create integrated workflows that seamlessly connect planning to execution.
Building the monday Dashboard for Financial Forecasting: Core Setup Processes

The foundation of any successful monday.com Dashboard starts with structured boards that match your workflow. Follow these steps:
Create separate boards for these elements:
Expense tracking.
Cash flow management.
Revenue projections.
Include columns for the following in each board:
Categories.
Status.
Amounts.
Owners.
Dates.
Add formula columns to calculate totals and variances.
Template to Use
There's a financial projections template that you can use. This is a spreadsheet-like interface facilitating seamless expense tracking and budget management. The essential components include:
Timeline columns for periods.
File columns for documentation.
Custom status columns for approvals.
Integration columns for system data.
Formula columns for calculations.
People columns for accountability.
Fruition will always suggest starting simple. You can add complex formulas as needed or seek assistance from a monday.com consultant. Either way, the financial forecasting dashboard in monday will adapt to evolving requirements.
A Collaborative Forecasting Process
Industry leaders note that financial forecasting evaluates the current fiscal condition with future projections to guide programmatic and policy decisions. Hence, it requires cross-organisational input.
For example:
Sales provides revenue projections.
Marketing outlines investments.
Operations confirms capacity.
HR plans headcount.
With the entire team involved, traditional tools often end up making collaboration difficult. That's why a collaborative budget vs actual reporting in monday brings stakeholders into a unified workspace.

Some of the collaboration features that help create accurate forecasts include:
Shared dashboards.
Guest access for consultants.
Department-specific boards.
Consistent templates.
In-context commenting.
Complete audit trails.
Departments can update boards while finance maintains visibility. Comments with @mentions can facilitate date discussions. Moreover, file attachments keep documentation connected.
Implementing Budget vs Actual Reporting in monday

According to Investopedia, budget variance is a periodic measure to quantify the differences between actual and budgeted figures for an accounting category. Budget variance tracking is indeed critical for control.
You'll need a properly configured cash flow visualisation tool to calculate planned vs actual performance. Here are the ways to do that:
Formula columns subtract actuals from budgets.
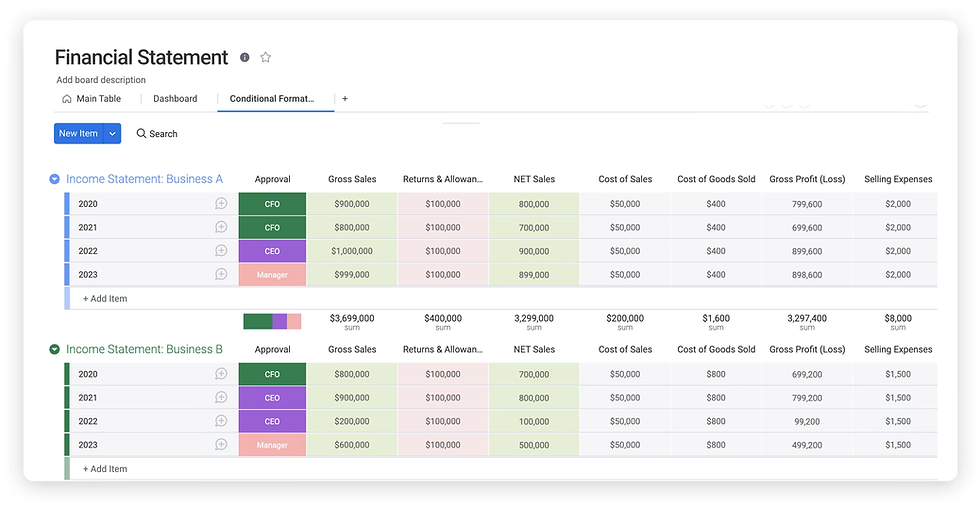
Conditional formatting highlights threshold-exceeding variances.
Create a board with the Numbers column for the budget forecast and actual spend. Use a Formula column to calculate the difference. Variance = Forecast - Actual.
The financial forecasting dashboard in monday will use data from connected budgets, projects, and expense tracking boards. As teams log costs, the variance reports update automatically for real-time over/under budget item tracking.
Variance Tracking Setup
EY reports that only 28% of cash forecasts hit within 10% accuracy. This demonstrated the need for real-time monitoring.
Follow these steps to eliminate manual reconciliation with the variance tracking setup in monday:
Schedule automated reports.
Create budget baseline boards.
Configure variance formulas.
Build variance widgets.
Link expense boards to categories.
Set threshold alerts.
Automating Workflows
Did you know that automation transforms finance operations by handling reports, reminders, and approvals? Deloitte revealed that 49% of CFOs want a finance team with top talent in automating processes.
In monday.com for accounting, you can configure automations where expenses exceeding budgets trigger notifications, variance thresholds create reports, and more. Other examples include:
Auto-generate period reports.
Create budget workflows.
Notify on KPI performance.
Schedule stakeholder reviews.
Deploying the Advanced Cash Flow Visualisation Tool Features
About 80% of small businesses in Australia face some form of cash flow challenge. That's why cash flow management requires proper forward-looking visibility.
A cash flow visualisation tool like monday can help depict positions across time, identify shortfalls early, and model scenarios. Here are some features you can use:
Boards for tracking inflows and outflows with due dates, amounts, probability, and categories.
Timeline views to visualise actual cash movement timing that enables real-time monitoring of inventory, payables, and receivables.
Fruition's monday.com experts implement sophisticated cash flow tracking that connects payment terms with project milestones and operation timelines. We'll also help with advanced capabilities like timeline payment schedules, scenario modelling, projected shortfall alerts, etc.
Visualising Performance with monday Widgets

The visual financial forecasting dashboard in monday uses charts, widgets, and more to highlight trends, track budget, variances, and KPIs. There are 30+ widget types for financial reporting.
Examples include:
Battery widgets show target progress.
Timeline widgets display cash flow schedules.
Chart widgets reveal trends.
Number widgets highlight metrics with colour-coded indicators.
Table widgets for variance tracking.
Line graphs for trend tracking.
Pie charts for expense categories.
Tip: Create different views for different audiences. For example, managers need variance details, CEOs must keep track of KPIs, and boards need trend comparisons.
Connecting Financial Planning with Operational Data
What's the most powerful aspect of the financial forecasting dashboard in monday? That'll be the ability to connect financial planning with operational reality.
Traditional forecasting happens in isolation. For instance, finance builds projections while operations track separately.
monday WorkOS eliminates these data silos through direct connections between financial and operational boards. For example, sales pipeline updates will adjust revenue forecasts, and revised project timelines will be reflected in expense projections.
Here's what you can do:
Connect expenses to projects.
Sync inventory schedules.
Link revenue to CRM pipelines.
Automate operational updates.
Align cash flow with receivables.
Integrate headcount plans.
Integrating with Financial Systems
The World of Work report reveals that 92% of senior leaders feel that they foster shared ownership. However, only 76% of individual contributors agree. This highlights a perception gap.
Thankfully, financial forecasts remain grounded in actual capacity and timelines in monday WorkOS. The financial forecasting dashboard in monday can generate data after connecting with accounting systems, CRM, ERP, and other related tools.
You can either use native connections or hire an automation specialist to create two-way connections with Make.com, monday API, or n8n. Some popular integrations are:
QuickBooks, NetSuite, and Xero accounting.
Salesforce and HubSpot pipelines.
Google Sheet collaboration and Excel Sheet legacy imports.
Stripe revenue metrics.
These are all bidirectional flows. That means system data populates boards automatically, while monday updates trigger external actions. All these eliminate double manual data entry.
To End With
The evolution to dynamic financial forecasting dashboards in monday represents fundamental shifts in finance operations. CFOs can now move from reactive reporting to proactive guidance by connecting financial planning to operational data.
With monday.com for finance and accounting, teams can get real-time visibility and automate tasks seamlessly. You can also gain insights from the budget vs actual reporting in monday features to guide your organisation through uncertainty.
Deloitte reports that 50% of CFOs cite digital finance transformation as their top priority in 2026. This proves how important a cash flow visualisation tool like monday WorkOS truly is.
Do you want to capitalise on these opportunities? Feel free to contact Fruition. Being monday.com experts, we'll create custom financial dashboards to deliver real-time visibility and strategic insights. We'll help your CFOs see clearly, decide quickly, and adapt constantly with monday.com.
FAQs
Can monday.com replace existing financial planning software?
monday.com for finance and accounting complements the existing tech stack. However, it doesn't replace core accounting systems. Instead, monday integrations with QuickBooks, Xero, and NetSuite can help consolidate data from multiple sources. As a result, you can build a custom dashboard to connect financial planning to operational execution.
How long does it take to implement a financial forecasting dashboard in monday?
Implementation timelines vary by complexity. Yet, most financial organisations launch a basic dashboard within 6 weeks. Collaborating with a consultant can help you create a financial forecasting dashboard in monday within 2 to 4 weeks. This will include board design, automation setups, integration configurations, and team training.
What level of technical expertise do you need to maintain monday.com financial dashboards?
monday WorkOS is a no-code interface. That means your CFOs can modify the dashboard without IT support. Complex integrations may require initial technical assistance. However, day-to-day management will need basic platform training and financial domain knowledge.


